
House prices in predominantly rural areas have risen by 22% over the last five years, compared to 17% in predominately urban areas, says the Nationwide.
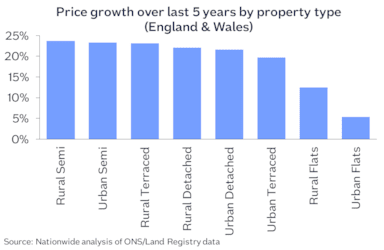
Specifically, rural semi-detached properties have seen the strongest rate of price growth, urban flats the weakest
Andrew Harvey, Nationwide's senior economist, says: “Our latest analysis suggests that average house price growth in local authorities classified as predominately rural has continued to outpace those of other areas. Between December 2018 and December 2023, average prices in predominately rural areas increased by 22%, compared with 17% in predominately urban areas. Local authorities classified as ‘urban with significant rural’ saw price growth of 19% over the same period.
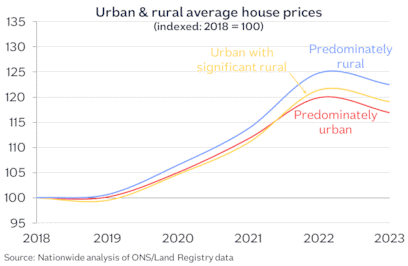
“Average house prices across both urban and rural areas declined a little overall during 2023, which reflects the rise in borrowing costs, which have added to affordability pressures.
“Despite rural areas performing better overall, only eight out of the 20 top performing local authorities in 2023 were classed as predominantly rural. Nonetheless, this does include a number of tourist hotspots such as Devon (South Hams and East Devon) and Westmorland & Furness in the Lake District. This suggests some of the demand may be being driven by those buying holiday or second homes. Indeed, ONS data suggests second home ownership is significantly above average in South Hams.
“We’ve used the ONS’ broad rural urban classification, which looks at the proportion of the population in local authorities living in different area types. In local authorities classed as ‘predominantly rural’, more than half of the population live either in rural settlements or market towns. In authorities classed as ‘urban with significant rural’, between 26% and 49% of the population live in either rural villages or market towns. In ‘predominantly urban’ local authorities, 75% or more of the population are either in towns or cities.”
“Of the 349 local authorities in Great Britain, 212 (61%) are classified as predominately urban, 89 (26%) as predominately rural, while the remaining 48 (14%) are classed as urban with significant rural. The South West has the highest proportion of rural local authorities, with over 50% being predominately rural (14 out of 26), while London unsurprisingly has none.”
Top performing local authorities (2023)
|
Local Authority
|
GOR
|
Type
|
Average price
|
% chg
|
|
Eilean Siar
|
Scotland
|
Rural
|
158,638
|
13%
|
|
East Renfrewshire
|
Scotland
|
Urban
|
304,160
|
10%
|
|
South Hams
|
S West
|
Rural
|
425,284
|
6%
|
|
Midlothian
|
Scotland
|
Urban
|
236,601
|
6%
|
|
West Lancashire
|
N West
|
Urban sig. rural
|
236,460
|
5%
|
|
East Devon
|
S West
|
Rural
|
357,534
|
5%
|
|
East Dunbartonshire
|
Scotland
|
Urban
|
271,624
|
4%
|
|
Winchester
|
S East
|
Rural
|
490,588
|
4%
|
|
Newcastle upon Tyne
|
N East
|
Urban
|
196,297
|
4%
|
|
Rossendale
|
N West
|
Urban
|
210,065
|
4%
|
|
Mole Valley
|
S East
|
Urban sig. rural
|
585,689
|
4%
|
|
North West Leicestershire
|
E Mids
|
Rural
|
266,301
|
4%
|
|
Dundee
|
Scotland
|
Urban
|
145,119
|
4%
|
|
Rutland
|
E Mids
|
Rural
|
390,970
|
3%
|
|
Chorley
|
N West
|
Urban sig. rural
|
235,612
|
3%
|
|
East Lothian
|
Scotland
|
Urban sig. rural
|
301,780
|
3%
|
|
Manchester
|
N West
|
Urban
|
248,260
|
3%
|
|
Edinburgh
|
Scotland
|
Urban
|
321,061
|
3%
|
|
Scottish Borders
|
Scotland
|
Rural
|
199,997
|
3%
|
|
Westmorland and Furness
|
N West
|
Rural
|
225,657
|
3%
|
Top performing rural local authorities (2023)
|
GOR
|
Local authority
|
Average price
|
% chg
|
|
Scotland
|
Eilean Siar
|
158,638
|
13%
|
|
S West
|
South Hams
|
425,284
|
6%
|
|
S East
|
Winchester
|
490,588
|
4%
|
|
East Mids
|
N West Leicestershire
|
266,301
|
4%
|
|
N West
|
Westmorland & Furness
|
225,657
|
3%
|
|
East
|
East Cambridgeshire
|
336,715
|
2%
|
|
W Mids
|
Wychavon
|
343,058
|
2%
|
|
N East
|
Northumberlamd
|
197,937
|
1%
|
|
Yorkshire
|
East Riding of Yorkshire
|
223,571
|
0%
|
|
Wales
|
Gwyneed
|
212,754
|
0%
|
Top performing urban local authorities (2023)
|
GOR
|
Local authority
|
Average price
|
% chg
|
|
Scotland
|
East Renfrewshire
|
304,160
|
10%
|
|
N East
|
Newcastle upon Tyne
|
196,297
|
4%
|
|
N West
|
Rossendale
|
210,065
|
4%
|
|
E Mids
|
Amber Valley
|
234,654
|
3%
|
|
Yorkshire
|
Calderdale
|
191,965
|
3%
|
|
W Mids
|
Bromsgrove
|
357,013
|
2%
|
|
S East
|
Worthing
|
350,822
|
2%
|
|
London
|
Richmond upon Thames
|
745,641
|
1%
|
|
Wales
|
Vale of Glamorgan
|
297,425
|
1%
|
|
S West
|
Bristol
|
355,199
|
0%
|
|
East
|
Basildon
|
375,622
|
-1%
|
Rural semi-detached properties have seen strongest price growth over last five years
“Increased demand for properties in rural areas over recent years has been part of the ‘race for space’ seen during the pandemic. However, it is actually rural semi-detached properties that have seen the strongest price growth between December 2018 and December 2023, with average prices increasing by 24%. (Note that due to data availability, these figures exclude Scottish local authorities)” continues Harvey.
“Rural terraces increased by 23% over the same period, as did urban semis, while rural detached properties increased by 22%. Flats saw considerably weaker price growth, particularly those in predominately urban areas, which increased by just 5% over the last five years.”


.png)


Join the conversation
Be the first to comment (please use the comment box below)
Please login to comment